After September's CPI, there is no new yearly inflation rate until 10 December
The CPI report on 14 October carries the last 12-month inflation rate until 10 December. October 2025 was never measured, so the report due on 10 November has no yearly rate. The Federal Reserve sets interest rates twice in between.
TwiceOver
The yearly inflation rate you get at 8:30 a.m. New York time on Wednesday 14 October is the last one until 10 December. That is 57 days, where the usual wait is about a month. The US central bank sets interest rates twice in that gap.
The rate comes from the Consumer Price Index, or CPI, which the Bureau of Labor Statistics (BLS) publishes each month. The CPI tracks what households pay for a fixed basket of goods and services. Its yearly rate compares prices this month with prices in the same month a year earlier. In August that rate was 3.4%.
1. Why the next report has no yearly rate
The US government was shut down from 1 October to 12 November 2025. BLS could not run its price survey for October 2025, and its data file shows a dash for that month. The note beside the dash reads “Data unavailable due to the 2025 lapse in appropriations.” Collection started again on 14 November, so November 2025 has a number.
The report on October 2026 prices is due on 10 November. A yearly rate for it would need October 2025 to compare against. BLS has ruled on that in writing.
“BLS will not publish 12-month percent changes for October 2026 for indexes where October 2025 data are not available.”
So on 10 November you get a monthly change with no yearly rate beside it. The yearly rate returns on 10 December, in the report on November prices.
| Date | What happens | Newest yearly CPI rate |
|---|---|---|
| 14 October | Report on September prices | September’s, new that day |
| 27 and 28 October | Fed meeting | September’s |
| 10 November | Report on October prices | September’s, because none is published |
| 8 and 9 December | Fed meeting | September’s |
| 10 December | Report on November prices | November’s |
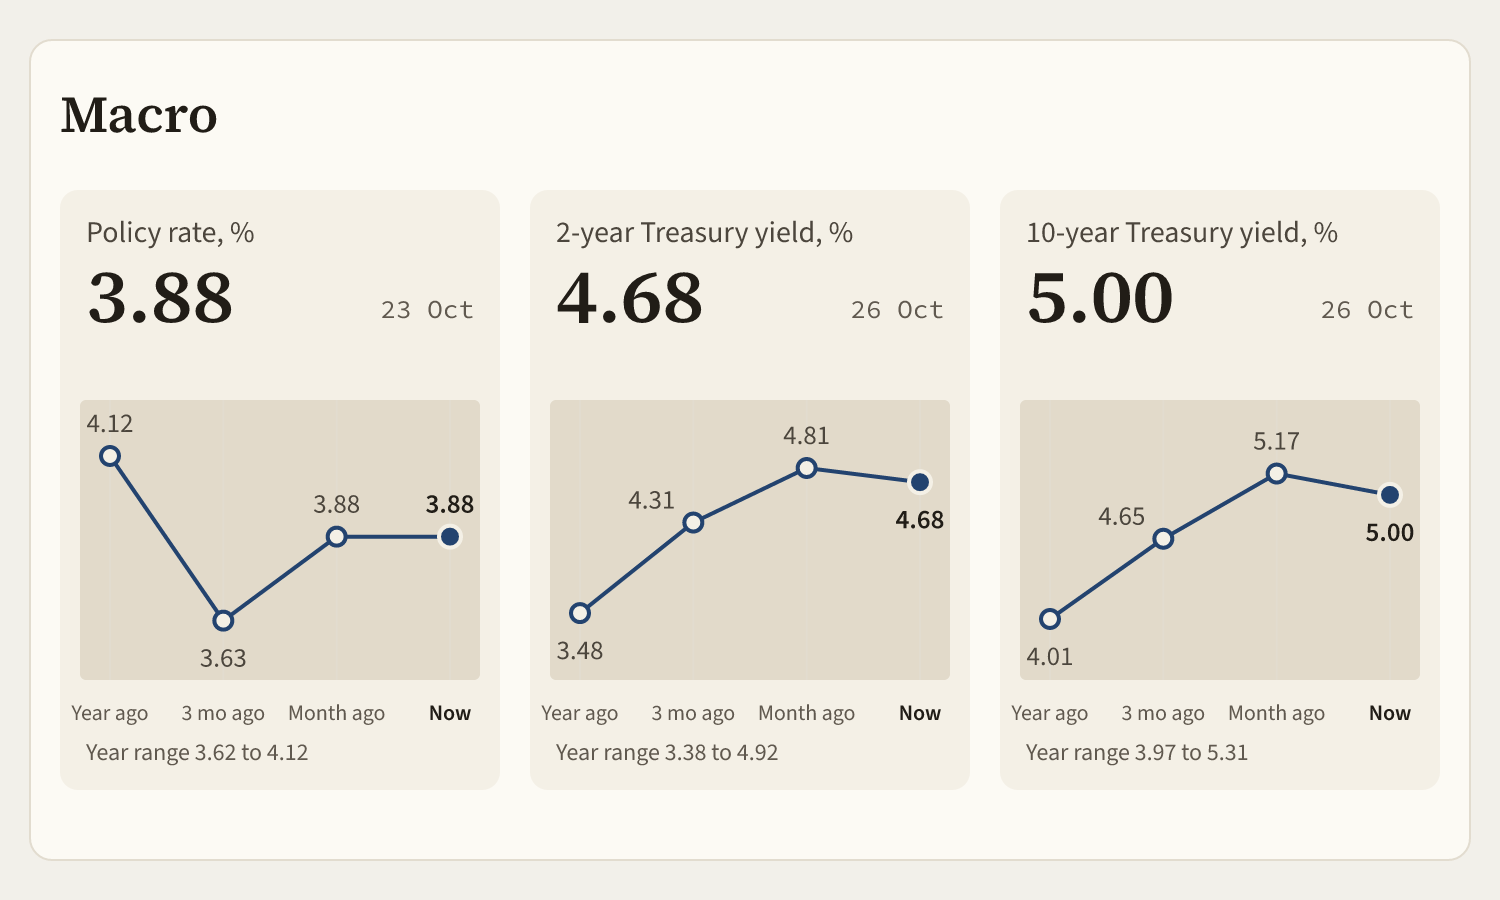
The Fed is the US central bank. On 16 September it raised its target for short-term interest rates to between 3.75% and 4%, and its statement said “Inflation remains elevated.” It has two decisions left this year. Both get made with September’s yearly rate as the newest one, and the December decision lands one day before the next.
2. Last September’s rise was 0.25%
BLS publishes the CPI as an index, one number for the price of the whole basket. It is set so that average prices in 1982 to 1984 equal 100. “All items” means the whole basket.
| Month | CPI index, all items |
|---|---|
| August 2025 | 323.976 |
| September 2025 | 324.800 |
| August 2026 | 334.980 |
August’s yearly rate is 334.980 divided by 323.976. That is 1.034, so prices were 3.4% higher than a year before.
The new yearly rate swaps both months forward. It is the September 2026 index divided by 324.800. Last September the index rose from 323.976 to 324.800, which is 0.254%. A rise of that size this September leaves the yearly rate where it is, and each extra tenth of a point adds about a tenth to it.
Take an index of 336.800 as an example. Divide by 324.800 and you get 1.037, a yearly rate of 3.7%. The same sum gives every outcome before the release.
| September 2026 index | Rise from August, about | Yearly rate in the report |
|---|---|---|
| 335.680 or lower | 0.2% or less | 3.3% or lower |
| 335.681 to 336.005 | 0.2% to 0.3% | 3.4%, unchanged |
| 336.006 to 336.330 | 0.3% to 0.4% | 3.5% |
| 336.331 to 336.655 | 0.4% to 0.5% | 3.6% |
| 336.656 to 336.979 | 0.5% to 0.6% | 3.7% |
| 336.980 or higher | 0.6% or more | 3.8% or higher |
The monthly change in the headlines needs one adjustment before it fits this table. That number is seasonally adjusted, meaning the usual swings of the calendar are taken out, and the yearly rate uses the raw index. Last September the adjusted rise was 0.295% and the raw rise was 0.254%. The raw number ran 0.04 of a point lower.
3. Where the forecasts land
RBC Economics forecasts an adjusted rise of 0.6% for September and a yearly rate of 3.7%. Take 0.04 off and the raw rise is about 0.56%. That lands in the 3.7% row.
Gasoline drives the forecast. In August, BLS said gasoline accounted for “over one third” of the monthly rise in the CPI. Energy prices as a whole were up 16.3% from August 2025.
Traders also watch core CPI, which leaves out food and energy. Its yearly rate was 2.4% in August, and the same sum works with core’s own index.
| Core CPI | Figure |
|---|---|
| September 2025 index | 330.804 |
| August 2026 index | 338.041 |
| September 2026 index for a 2.4% yearly rate | 338.578 to 338.908 |
| September 2026 index for a 2.5% yearly rate | 338.909 to 339.239 |
The line between the two is a rise of 0.26% from August. Forecasts for core’s monthly rise sit near 0.2%, close enough to that line that published forecasts for the yearly rate split between 2.4% and 2.5%.
4. What happens next
We expect the report to show a yearly rate of 3.7%. The Fed then decides on 28 October and on 9 December with that figure as the newest yearly rate in front of it. By the December meeting it is eight weeks old.
On 10 November anyone who wants a yearly rate for October has to build one. BLS built a stand-in for the October 2025 index and used it only for seasonal adjustment. Its method was the geometric mean of the September and November 2025 indexes, which is the square root of the two multiplied together. With November 2025 at 324.122, that gives 324.461 for all items.
What to check at 8:30
- The September 2026 index for all items, before seasonal adjustment. Divide it by 324.800 and subtract 1.
- The same index for core. Divide it by 330.804 and subtract 1.
- The next release is on 10 November. Its all-items number is a monthly change only.
Sources BLS CPI release, BLS shutdown notes, BLS data, Federal Reserve, RBC Economics