Fed decision: bond traders expect higher rates than the Fed’s own forecast
On Monday the US government paid 4.68% to borrow for two years. The Fed’s September forecast keeps the Fed’s own rate near 4.1% through 2027. The bond market’s prices point to more rate increases than the Fed has forecast.
TwiceOver
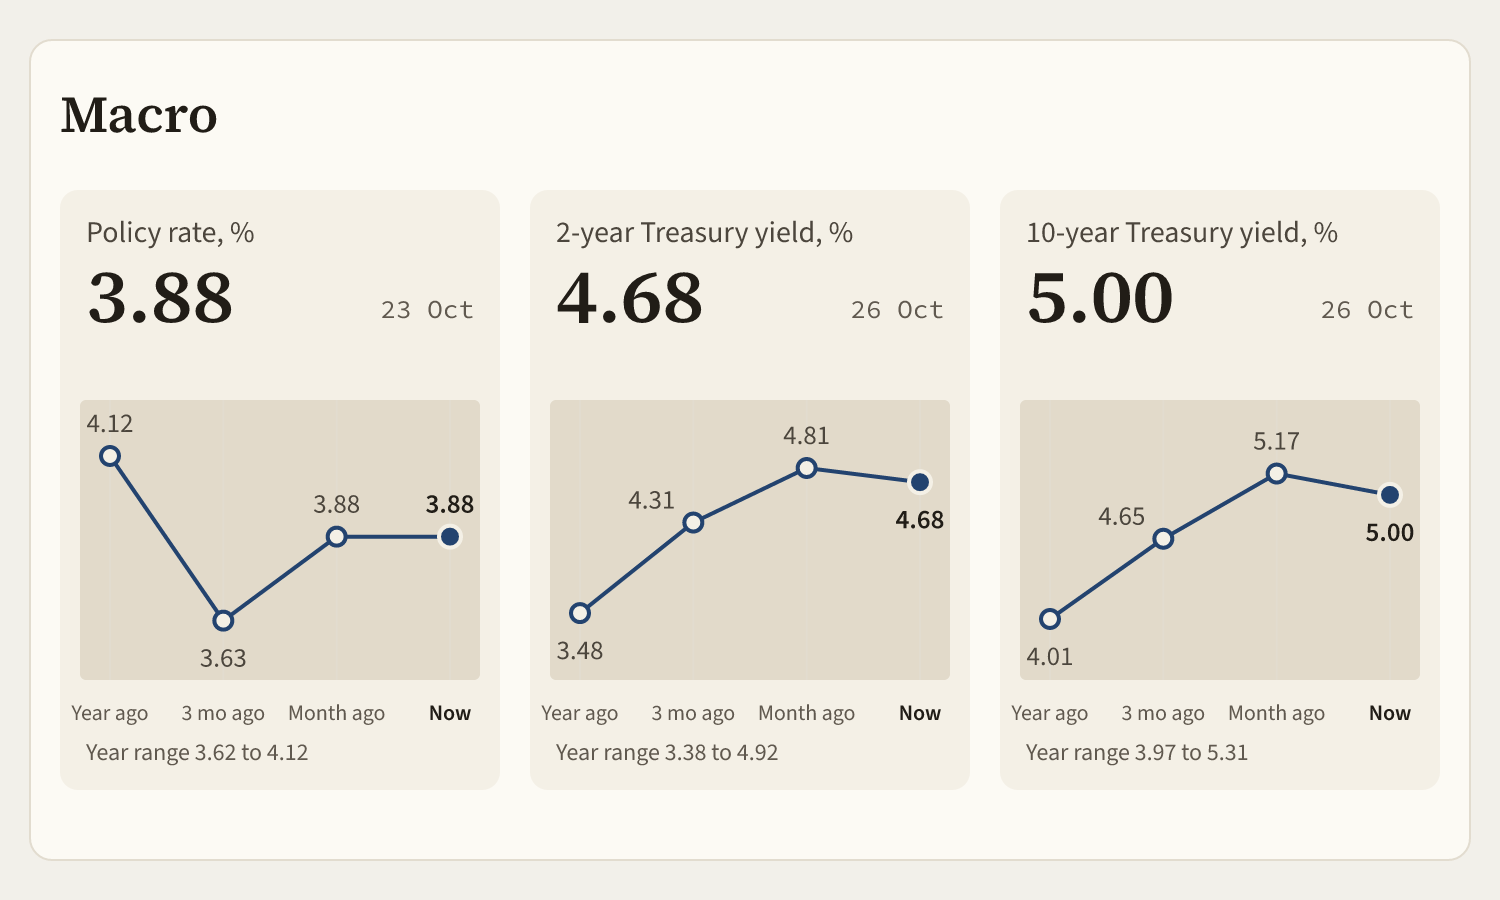
Bond traders expect the Fed to take interest rates higher than its own forecast says. On Monday the US government paid 4.68% a year to borrow for two years. The Fed’s September forecast has the Fed’s rate ending this year near 4.1% and staying there through 2027. The Fed announces today’s decision at 2:00 p.m. New York time.
The picture above shows the Fed’s policy rate, the 2-year and the 10-year the way TwiceOver’s analysis draws them in its macro section. Each one appears a year ago, three months ago, a month ago and now, inside its range for the year. The picture’s policy rate is the overnight rate banks actually paid each other, 3.88% on 23 October, inside the Fed’s range of 3.75 to 4%.
1. What the Fed’s September documents say
The Fed sets a target range for the rate banks charge each other overnight, the federal funds rate. The Fed’s last statement, on 16 September, moved that range up. The statement is short, and the decision is one line. The Committee it names is the Fed’s rate-setting committee.
“The Committee decided to raise the target range for the federal funds rate by 1/4 percentage point to 3-3/4 to 4 percent”
The vote was 12 to 0. The same statement says “Inflation remains elevated.” September’s move was the Fed’s first increase after three cuts from September to December 2025.
The Fed published forecasts the same day. Each official writes down where they think the rate belongs at the end of each year, and the Fed prints the middle answer. Here is that middle answer, against the one from June.
| End of | September forecast | June forecast |
|---|---|---|
| 2026 | 4.1% | 3.8% |
| 2027 | 4.1% | 3.6% |
| 2028 | 3.9% | 3.4% |
| Longer run | 3.2% | 3.1% |
A rate of 4.1% at the end of 2026 is the middle of a range of 4 to 4.25%. Getting there takes one more quarter-point increase this year. The September forecast then holds the rate at that level through 2027.
2. What the Treasury market says
The US Treasury publishes what its debt pays each day, for loans from one month to thirty years. Here are the main loans up to two years, and the 10-year, a year apart.
| Loan to the government for | 27 Oct 2025 | 26 Oct 2026 |
|---|---|---|
| 1 month | 4.09% | 4.11% |
| 3 months | 3.89% | 4.22% |
| 6 months | 3.73% | 4.35% |
| 1 year | 3.59% | 4.47% |
| 2 years | 3.48% | 4.68% |
| 10 years | 4.01% | 5.00% |
| The Fed’s range that day | 4.00 to 4.25% | 3.75 to 4.00% |
A year ago the loans from three months to two years all paid below the Fed’s range, because lenders expected cuts. The Fed cut twice in the seven weeks after that date. Monday’s column climbs at every step, from 4.11% at one month to 4.68% at two years, and every yield in it is above 4%, the top of today’s range.
These rates also set the bar for other trades. How a six-month bill’s rate decides what a takeover spread is worth is worked out in the post on Silence Therapeutics and Merck KGaA.
3. The gap, worked out
A two-year loan to the government pays about what eight three-month loans in a row would pay. If the Fed’s rate followed its September forecast, those eight loans would average about 4.1%. The 2-year paid 4.68% on Monday, 26 October.
That is about 0.6 points above the Fed’s own path. A quarter-point increase made now and held for the whole two years adds 0.25 to that average, and one made later adds less. So the gap is room for about two increases beyond the forecast if they came soon, and more if they came later. Whatever lenders charge for tying money up longer comes out of that room.
The 1-year loan tells the same story at a shorter distance. It pays 4.47%, against a forecast that tops out at 4.1% over the same twelve months.
4. Why lenders want more: the price figures
The Bureau of Labor Statistics put consumer prices 3.7% above a year earlier in September. Prices rose 0.6% in September alone. Gasoline rose 9.1% that month and made up over half of the rise. Prices excluding food and energy rose 2.6% over the year.
Energy did most of the moving. A barrel of Brent crude cost $115.22 on 20 October, against $65.52 in late October 2025. The Fed forecasts inflation with a different index, the price of personal consumption, and puts that inflation at 3.7% for 2026. In June the Fed said 3.6%.
How the September report was put together, and why the next yearly rate waits until 10 December, is in the post on September’s inflation report.
5. Today, and December
Today’s statement comes without new forecasts. The Fed next publishes them after its 8 and 9 December meeting.
The 2-year has paid well above the Fed’s forecast path every day since that forecast came out. The gap was wider a month ago, when the 2-year paid 4.81% on 25 September. We expect December’s forecast for 2027 to move up toward the 2-year. Between June and September the Fed already raised its 2027 figure by half a point, from 3.6% to 4.1%.
Sources Fed statement, 16 Sep 2026, Fed projections, Sep 2026, US Treasury yield curve, BLS CPI release, FRED