15 of 25 stocks stayed inside the move options priced for earnings, and the other 10 averaged double it
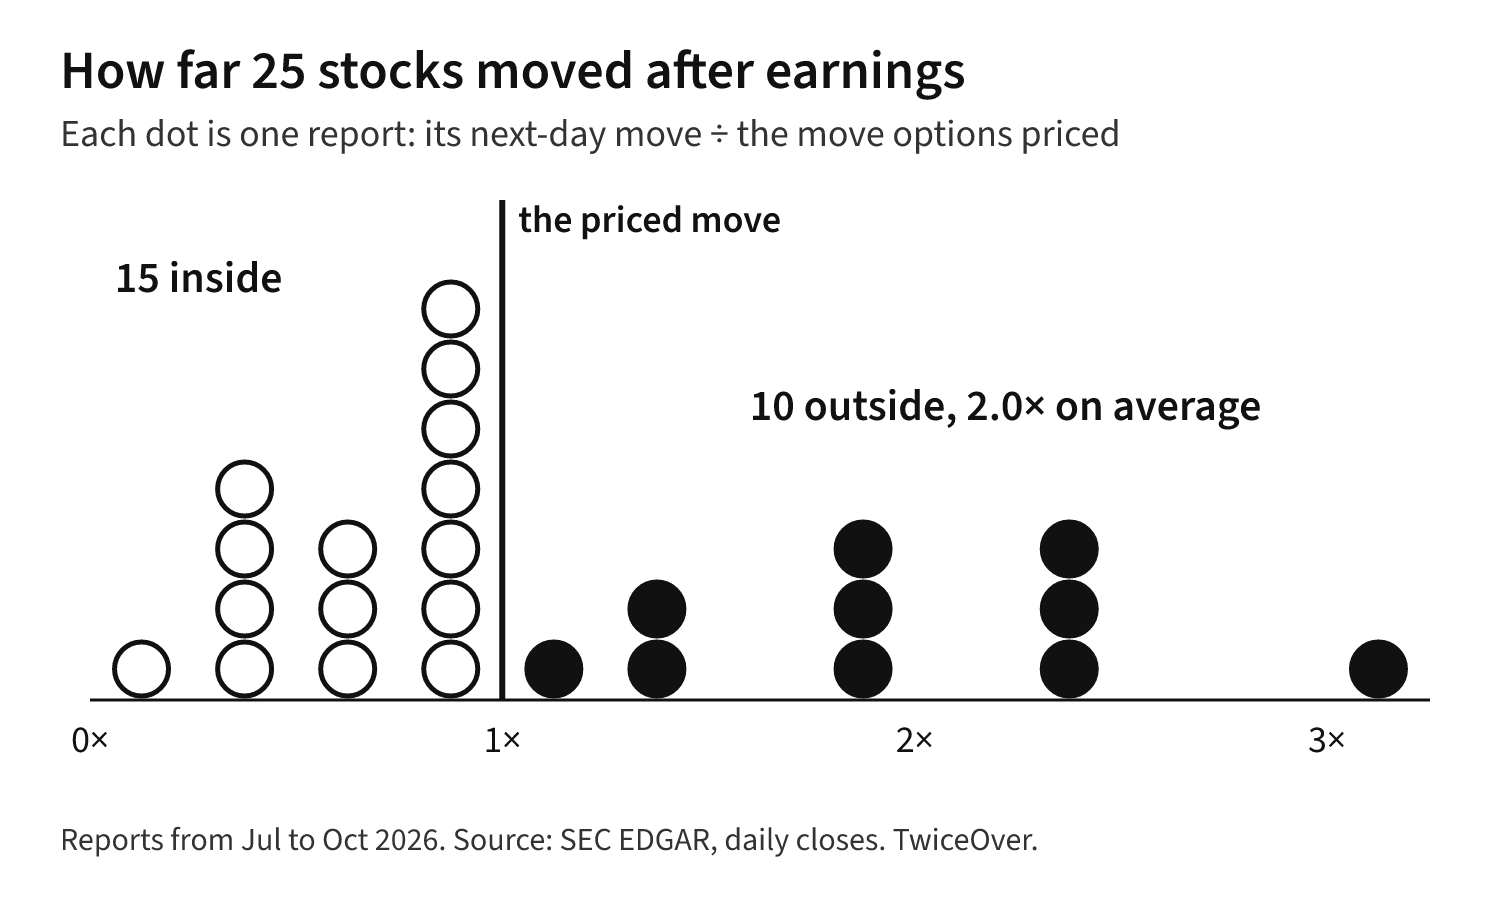
Before a company reports, the options market prices the average size of move it expects. A few big moves pull an average up, so most stocks finish inside it. Of 25 big reports from July to October 2026, 15 stayed inside and the other 10 averaged double their priced move.
TwiceOver
Before a company reports earnings, its options carry a price for the size of the next move. That price is the average size of move the market expects. A few big days pull an average up. So most stocks finish inside the priced move, and the ones that break out go far.
The pattern shows in 25 big US reports from July to October 2026. Fifteen stocks moved less than their options had priced. The breakouts averaged twice the priced move.
1. Where the priced move comes from
Take a stock at $100 the night before it reports. Two options trade on it with a $100 strike and the same expiration date. The call pays if the stock ends above $100, and the put pays below it. Owned together, the pair is a straddle.
Say the pair costs $8. Divide by the stock price. $8 ÷ $100 is 8%. That 8% is the implied move. Traders also call it the expected move.
On its last day, the pair is worth exactly how far the stock ended from $100.
| Stock on the last day | Call | Put | The pair |
|---|---|---|---|
| $86 | $0 | $14 | $14 |
| $96 | $0 | $4 | $4 |
| $100 | $0 | $0 | $0 |
| $104 | $4 | $0 | $4 |
| $114 | $14 | $0 | $14 |
2. Why the price is an average
The pair pays the distance, in either direction. So a fair price for it is the average distance. That is the whole idea, before interest and dividends.
An average gets pulled up by the big days. Picture ten reports on that $100 stock. Six end 4% away. Four end 14% away. The average distance is (6 × 4 + 4 × 14) ÷ 10, which is 8%. That is the $8 price. Six of the ten finish inside it.
The bell curve that standard option models start from gives a similar split. On that curve, the average move is 0.8 of one standard deviation, the curve’s usual swing. The stock finishes inside the average move 58 times in 100.
3. What 25 reports did
These are the latest reports, as of 9 October, of 25 widely followed US companies, picked before any move was looked up. The report date is the day the results came out. The priced move is the pair’s price over the stock price at the last close before the results, using the strike nearest that close and the first expiration after the report. The move is the next session’s close against that close. Where the expiration falls later in the week, the price also covers those extra days. The last column is computed before rounding, so it can differ a little from dividing the rounded figures.
| Company | Report | Priced | Moved | Moved ÷ priced |
|---|---|---|---|---|
| Salesforce | 26 Aug | 7.2% | up 22.6% | 3.12 |
| Tesla | 22 Jul | 5.9% | down 14.5% | 2.45 |
| Palantir | 3 Aug | 12.2% | up 29.5% | 2.42 |
| Microsoft | 29 Jul | 6.8% | up 15.5% | 2.28 |
| Apple | 30 Jul | 3.8% | down 7.4% | 1.92 |
| Amazon | 30 Jul | 8.3% | up 15.3% | 1.85 |
| Walmart | 20 Aug | 5.0% | down 9.2% | 1.82 |
| NVIDIA | 26 Aug | 5.9% | up 8.7% | 1.47 |
| Coinbase | 30 Jul | 7.3% | down 10.6% | 1.46 |
| Alphabet | 22 Jul | 5.9% | down 7.1% | 1.20 |
| Costco | 24 Sep | 3.0% | up 2.9% | 0.98 |
| Meta Platforms | 29 Jul | 8.7% | down 8.0% | 0.92 |
| Advanced Micro Devices | 4 Aug | 8.0% | down 7.0% | 0.89 |
| Boeing | 28 Jul | 5.4% | up 4.8% | 0.88 |
| Snap | 3 Aug | 17.5% | up 14.9% | 0.85 |
| Netflix | 16 Jul | 9.4% | down 7.3% | 0.77 |
| JPMorgan Chase | 14 Jul | 3.3% | up 2.5% | 0.75 |
| Uber | 5 Aug | 7.4% | down 5.3% | 0.72 |
| Intel | 23 Jul | 12.2% | down 7.9% | 0.65 |
| Walt Disney | 5 Aug | 6.2% | up 3.6% | 0.59 |
| Micron | 30 Sep | 7.4% | up 3.0% | 0.41 |
| Nike | 1 Oct | 8.9% | down 3.6% | 0.41 |
| Robinhood | 29 Jul | 9.6% | down 3.6% | 0.37 |
| Starbucks | 29 Jul | 5.9% | up 1.6% | 0.28 |
| Oracle | 10 Sep | 12.4% | down 1.7% | 0.14 |
Now the arithmetic.
- 15 of 25 stayed inside. That is 60 in 100. The bell curve said 58.
- Those 15 moved 0.64 of their priced move, on average.
- The 10 that broke out moved 2.0 times their priced move, on average. They ran from 1.20 times for Alphabet to 3.12 times for Salesforce, which priced 7.2% and moved 22.6%.
- The middle report moved 0.89 of its priced move. That was Advanced Micro Devices.
- Across all 25, the priced move averaged 7.7%. The actual move averaged 8.7%. In this season the ten breakouts were big enough to carry the average a point past the price.
4. The same math in dollars
One contract covers 100 shares. The $8 pair costs $800.
Run the ten reports from section 2. Six times the stock ends 4% away, so the pair is worth $400 and its owner is down $400 each time. On the other four reports the stock ends 14% away. That pays $1,400, a $600 gain on each.
Six losses of $400 and four gains of $600 both come to $2,400, so the owner nets zero. The owner lost money on six of the ten reports.
5. Run it on the next report
Take the pair’s price the night before a report and divide it by the stock price. Then put the next day’s move over that number. Under 1 is inside. The table above is 25 of those.
Try your own numbers in the implied move tool. Guess five of these reports yourself in Guess the gap. For more on earnings day, read what Citigroup kept outside its earnings release and what an expiring option can do after the close.
Sources SEC EDGAR, Daily stock and option closes, Own calculation