In the 1987 crash, four sellers made 14% of the stock sales
On Black Monday, 19 October 1987, the Dow fell 22.6%. The report President Reagan ordered counted who sold. Four sellers accounted for $2.85 billion of stock, 14% of the day's sales.
TwiceOver
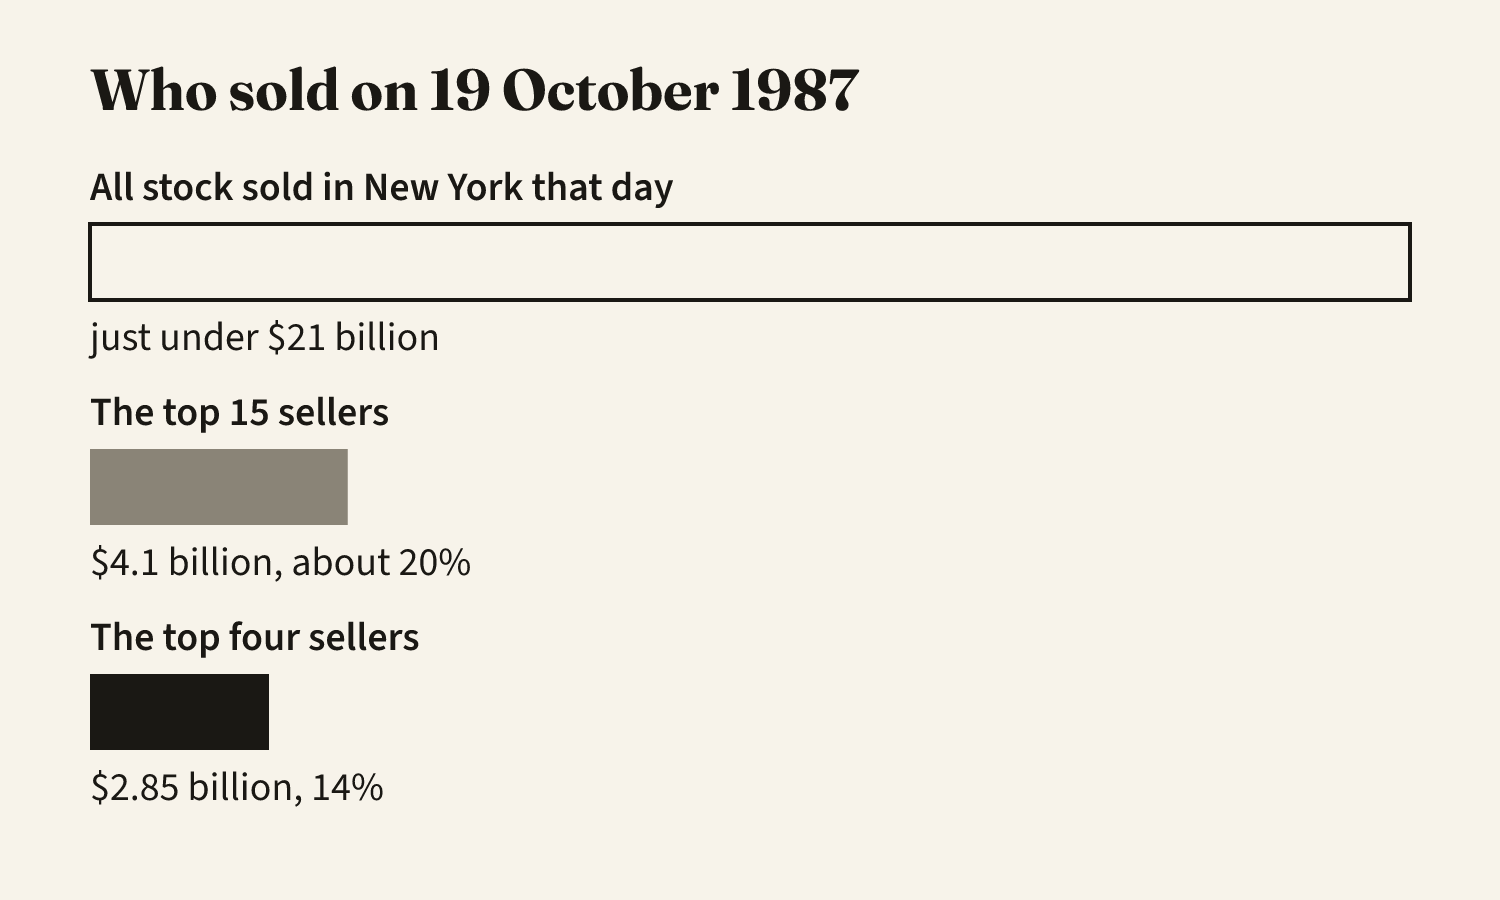
“In the stock market, the top four sellers alone accounted for $2.85 billion, or 14 percent of total sales.” That is about $710 million each, in one day. The same report says “an investor transacting $10 million on a normal day would be considered an active trader.”
The day is Monday 19 October 1987, when the Dow Jones Industrial Average fell 22.6% in one session. The document is the Report of the Presidential Task Force on Market Mechanisms, known as the Brady Report after its chairman, Nicholas Brady. President Reagan set up the task force by executive order on 5 November 1987, and it reported to him on 8 January 1988.
The day, in the report’s numbers
| What | Figure |
|---|---|
| The Dow’s fall on 19 October | 508 points, or 22.6% |
| Where the Dow closed | 1,738 |
| The Dow’s fall from 13 October to 19 October | 769 points, or 31% |
| Shares traded on the New York Stock Exchange on 19 October | 604 million |
| What those shares were worth | just under $21 billion |
| The fall in S&P 500 futures on 19 October | 29% |
The Dow is an average of 30 large American stocks. S&P 500 futures are contracts to trade a 500-stock index at a later date. They trade in Chicago, in a market of their own, and they fell further than the stocks did.
The report compares the day with 1929. The Dow fell 12.8% on 28 October 1929 and 11.7% the day after. It calls 19 October 1987 “perhaps the worst day in the history of U.S. equity markets.”
Who sold
“This trading activity was concentrated in the hands of a surprisingly few institutions.”
| Who | Sold on 19 October | Share of the day |
|---|---|---|
| The top four sellers of stock | $2.85 billion | 14% of all stock sales |
| The top 15 sellers of stock | $4.1 billion | about 20% of all stock sales |
| The top 10 sellers of futures | equal to $5 billion of stock | roughly 50% of futures volume, leaving out market makers, the dealers who quote prices all day |
The futures sales come on top of the $21 billion of stock. The report describes the sellers by type and leaves out their names. Two types carry its account.
- Portfolio insurers. These were funds run on a formula that sold as prices fell, to limit the fund’s loss. Three of them sold just under $2 billion of stock that day. In the futures market, three insurers sold contracts equal to another $2.8 billion of stock. The report does not say whether they were the same three.
- Mutual funds. A mutual fund pools its customers’ money and pays them out when they ask. A few funds sold about $900 million of stock in large single trades. “About 90 percent of these sales were executed by one mutual fund group.”
The selling still to come
The report describes the usual formula. A typical model, it says, “calls for stock sales in excess of 20 percent of a portfolio in response to a 10 percent decline in the market.” It puts $60 to $90 billion of stock under plans of this kind.
The market was already down 10% when Monday began. By the report’s arithmetic, the formulas called for at least $12 billion of sales by then. “Less than $4 billion had in fact been sold.”
So the insurers started Monday more than $8 billion behind their own formulas. The mutual funds were behind as well. On Friday 16 October, their customers cashed out $750 million more than the funds had sold in stock.
Other traders understood how these funds worked. The report says of them: “They could anticipate the selling those institutions would have to do”. They sold ahead of it.
The report calls the pattern “mechanical, price-insensitive selling”, meaning sales made by rule, whatever the price. By its count, most of that selling had still not happened by Monday night. The insurers’ sales that day, it says, were “a small fraction of the sales dictated by the formulas of their models.”
“A handful of large investors provided the impetus for the sharpness of the decline.”
What the report asked for
The task force found that stocks, index futures and stock options “are in fact one market”. It says the links between the three failed in October 1987. It made five proposals.
- A single agency to coordinate the few rules that reach across all three markets.
- One clearing system across them. Clearing is the step that settles who owes what after a trade.
- Margins that match from market to market. Margin is the deposit a trader posts against a position.
- Circuit breakers, which it describes as “price limits and coordinated trading halts”.
- Information systems that watch trading in the related markets together.
What it teaches today
The fourth proposal is easy to find today. The New York Stock Exchange lists three levels at which trading stops across US markets. They are a fall of 7%, 13% and 20% in the S&P 500 from the prior day’s close. In 1987 no rule of that kind existed.
A halt gives buyers time to arrive, and the formula sellers are still there when trading starts again.
A short list of institutions set the pace of the 1987 crash, and the report had the numbers to say so. Its method fits any sharp fall. It counts who is selling by rule, and how much they have left to do.
Sources Brady Report 1988, NYSE